Latest Speed Limit Dashboard Published
16/06/2026BeBuilder #338
14/08/2026News:
How Accurate Is Free OSM Speed Limit Data?
First full national comparison of Insight Warehouse SpeedMap against OpenStreetMap across 427,659km of Great Britain's road network
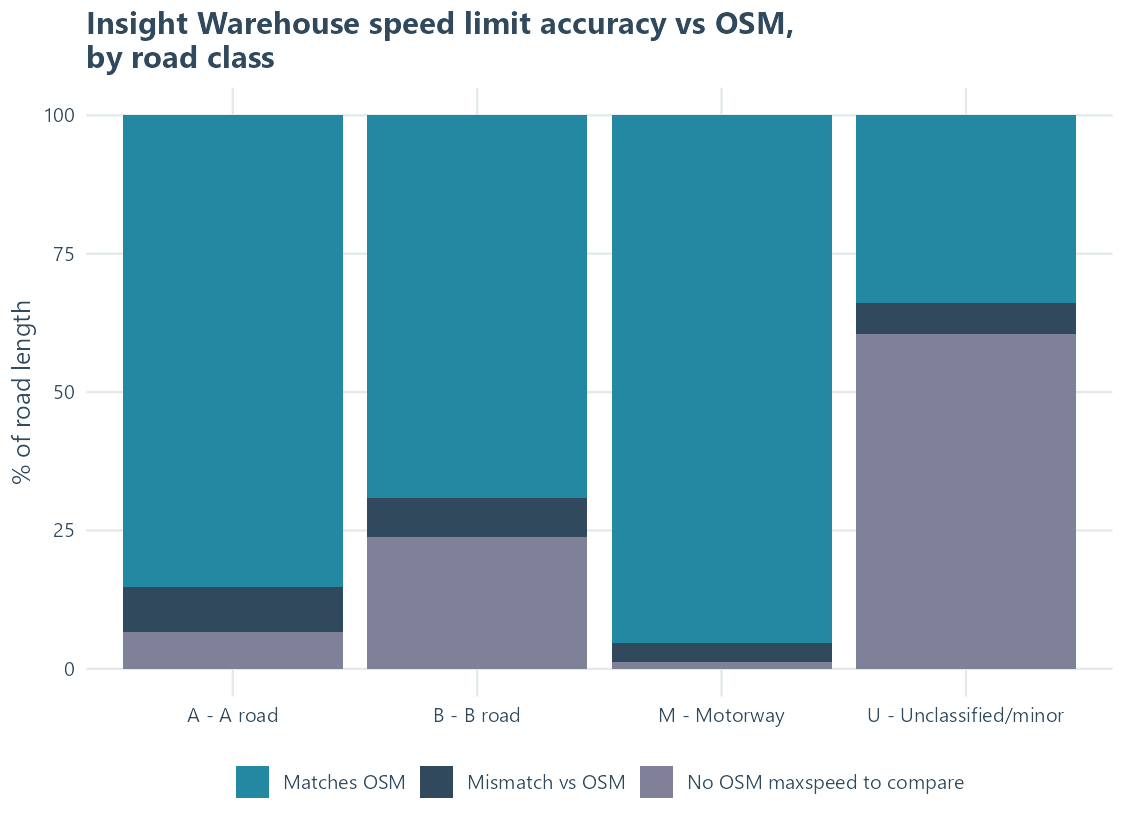
Where OSM records a speed limit at all, Insight Warehouse agrees with it 87.9% of the time by road length. But that comparison can only happen on the roads where OSM has bothered to record a value in the first place.
That's the more striking finding: OSM has no speed limit recorded at all for 49.4% of the road network by length nationally, rising to over 60% on unclassified/minor roads — which make up more than three-quarters of the network. Insight Warehouse has a speed limit recorded for 100% of the network, on every road class.
We analysed 427,659km of road across Great Britain — 2.2 million individual road links — comparing our SpeedMap database against OSM's maxspeed tag, road class by road class, speed limit by speed limit.
Where free, crowd-sourced data does have an answer we can help and it's why we are her ein the first place. Coverage and quality are the reasons why so many of our clients come to us after finding OSM's coverage isn't enough for products where getting the speed limit wrong has real consequences.
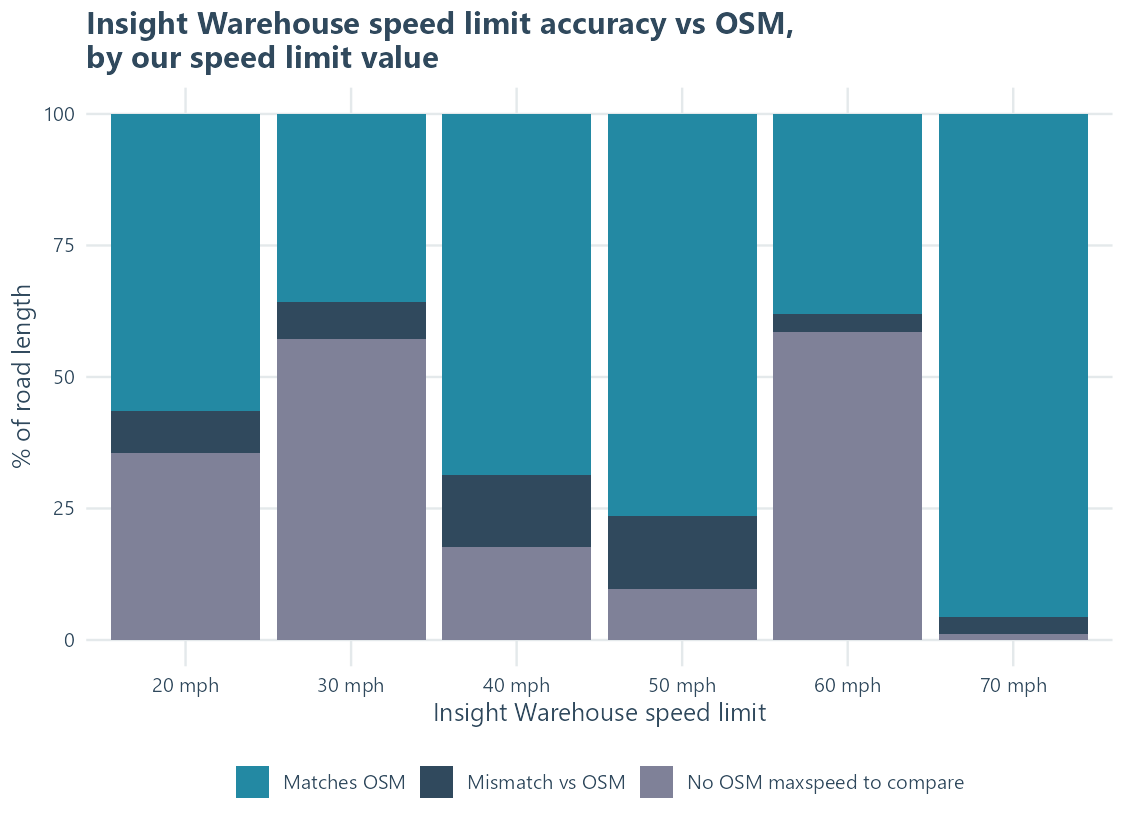
Which speed limits disagree most?
We also broke the comparison down by our own recorded speed limit, to see whether particular limits are more contested than others.
70mph and 60mph roads show the strongest agreement (96.8% and 91.8% match respectively) – the roads defined by the national speed limit are the ones everyone agrees on.
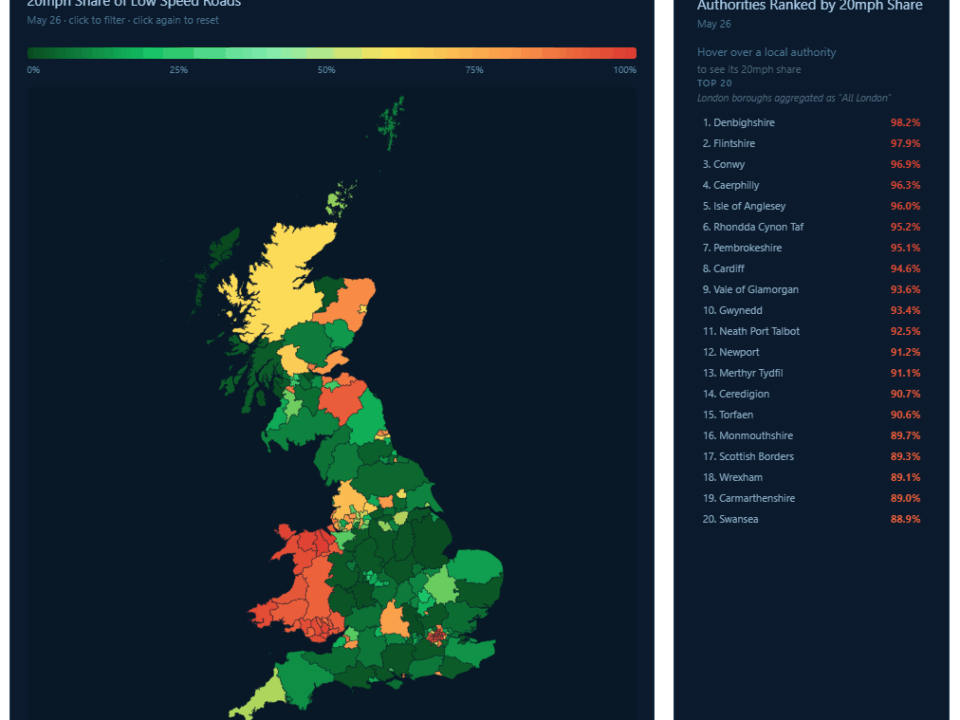
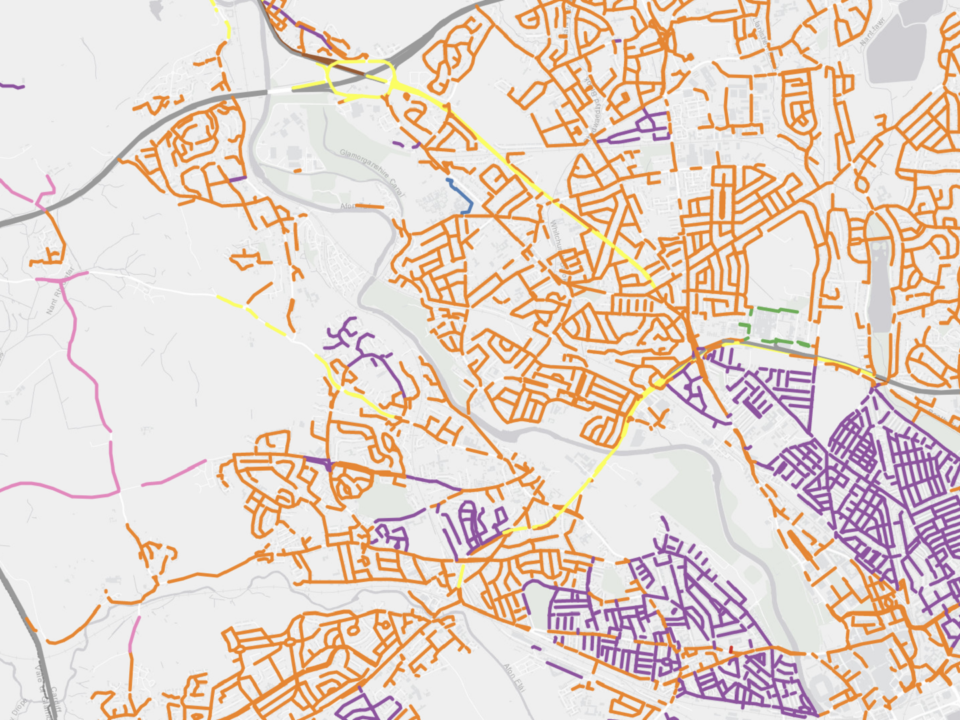
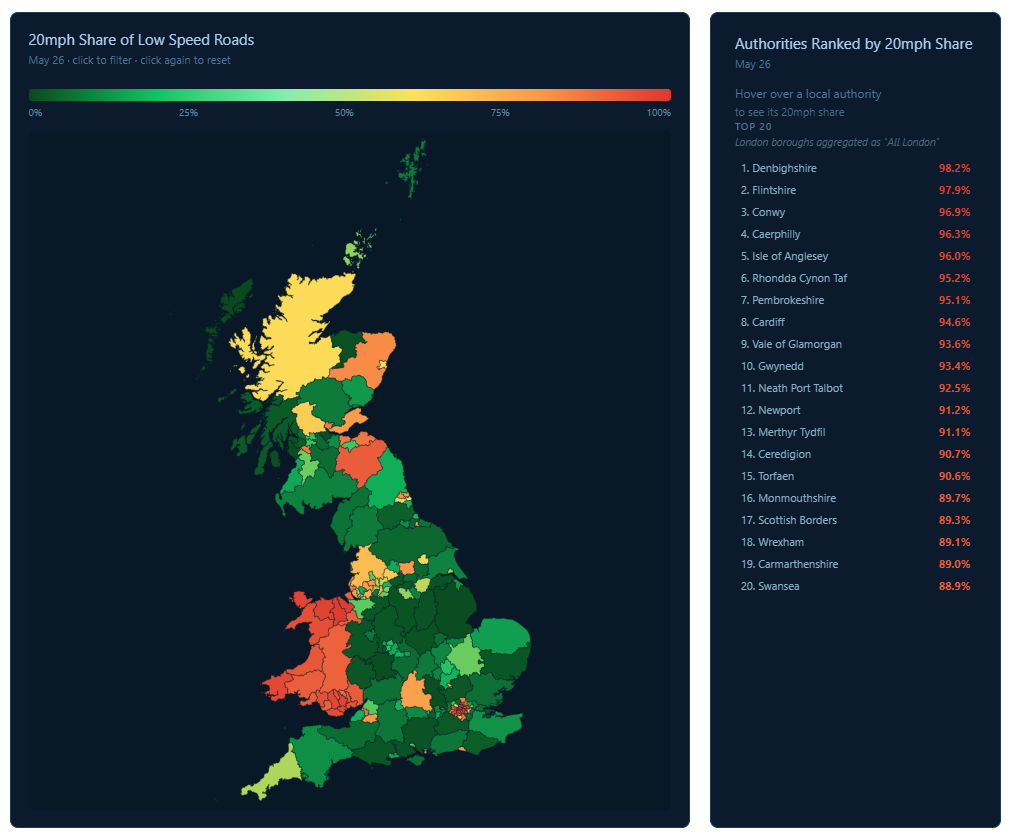
Urban 20mph and 30mph roads see more disagreement (87.4% and 83.8% match) – not surprising given how recently many 20mph zones have been introduced.
40mph and 50mph roads, typically set by a Traffic Regulation Order rather than a default national limit, show the most disagreement of all (83.3% and 84.5% match).
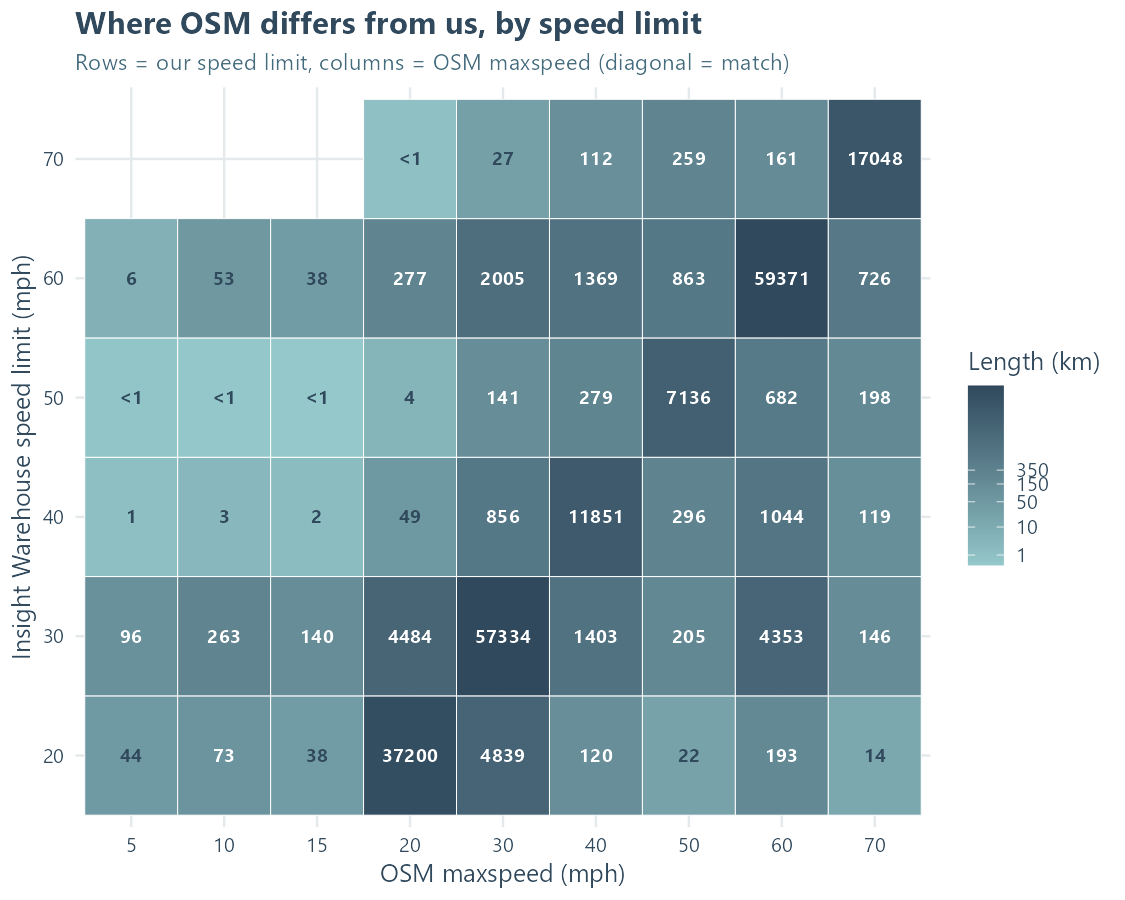
So where exactly does OSM differ from us?
Rather than just report a mismatch rate, we cross-tabbed our speed limit against OSM's for every disagreeing road link. The pattern isn't random – a handful of specific mix-ups account for most of the mismatched length nationally:
- Our 30mph vs OSM 20mph: 4,484km – the single largest mismatch category nationally
- Our 20mph vs OSM 30mph: 4,839km – the reverse of the above; together these two account for the bulk of all mismatches
- Our 30mph vs OSM 60mph: 4,353km
- Our 60mph vs OSM 30mph: 2,005km
- Our 60mph vs OSM 40mph: 1,369km
The 20/30mph confusion running in both directions looks like a boundary or tagging issue – 20mph zones not fully reflected in one dataset or the other – rather than a random data quality problem, and is the first thing we're checking as part of our independent verification exercise.
What happens next?
We're confident in our own data, but the only way to prove it is against ground truth – and there's no official national map of speed limits to check against (part of the reason SpeedMap exists in the first place). So rather than claim victory, we've pulled a stratified sample of 1,337 mismatched links – up to 50 per road class and speed-limit combination – for independent verification over the coming weeks. We'll publish the results once that's back.